將資料畫在地圖上
有了地圖之後,接著就是要將自己的資料畫在地圖上,我們以台灣的紫外線監測資料為例,示範如何將具有經緯度的資料畫在地圖上。
首先從政府資料開放平臺上下載紫外線即時監測資料的 csv 檔,接著將資料讀進 R 中。(這裡我用的資料是 2015/11/16 15:22:15 的資料)
uv <- read.csv("UV_20151116152215.csv")
這裡原始的經緯度資料是以度分秒表示,在使用前要轉換為度數表示。
lon.deg <- sapply((strsplit(as.character(uv$WGS84Lon), ",")), as.numeric)
uv$lon <- lon.deg[1, ] + lon.deg[2, ]/60 + lon.deg[3, ]/3600
lat.deg <- sapply((strsplit(as.character(uv$WGS84Lat), ",")), as.numeric)
uv$lat <- lat.deg[1, ] + lat.deg[2, ]/60 + lat.deg[3, ]/3600
接著使用 ggplot 的語法,把資料加入地圖中:
library(ggmap)
map <- get_map(location = 'Taiwan', zoom = 7)
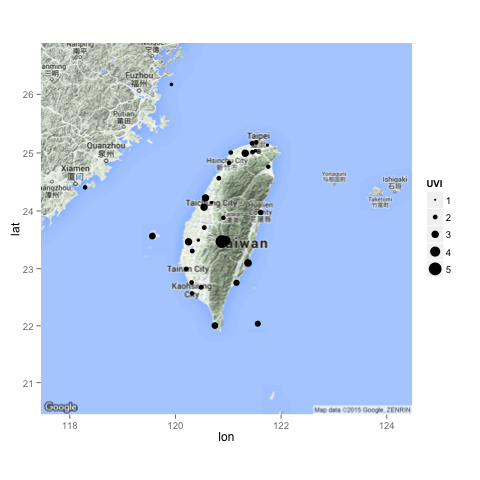
ggmap(map) + geom_point(aes(x = lon, y = lat, size = UVI), data = uv)
ggmap 負責畫出基本的地圖,然後再使用 geom_point 加上資料點,除了指定經緯度之外,我們還使用紫外線的強度(UVI)來指定圓圈的大小。這是畫出來的圖:
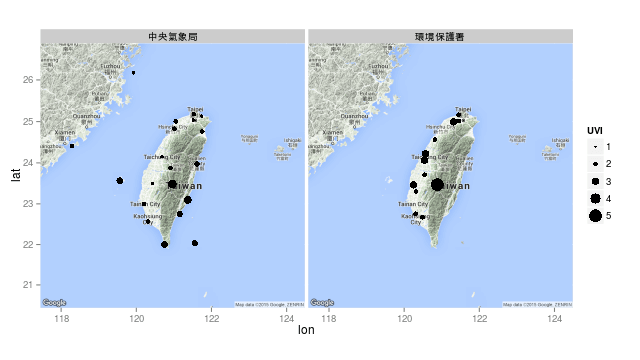
依照資料發佈單位(PublishAgency)分開畫圖:
ggmap(map) +
  geom_point(aes(x = lon, y = lat, size = UVI), data = uv) +
  facet_grid( ~ PublishAgency)
這是畫出來的圖:
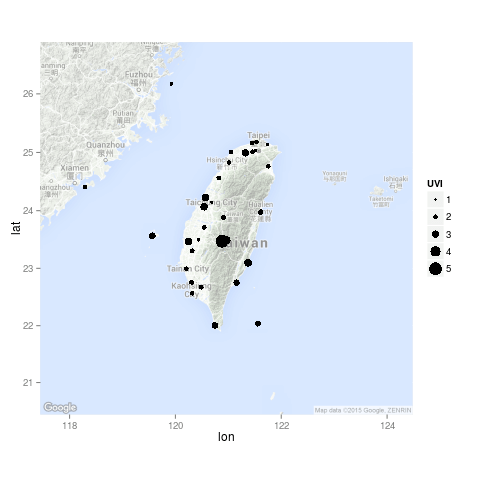
把地圖的顏色調淡一點,讓資料點更清楚:
ggmap(map, darken = c(0.5, "white")) +
  geom_point(aes(x = lon, y = lat, size = UVI), data = uv)
這是畫出來的圖:


YU
您好!
非常感谢您的教学
我想请问您 通过ggmap这个package我们如何在地图上标注不同的点?
我简单介绍一下问题:
我们需要在地图上标注出4所商场的顾客的地理位置 我们现在拥有一个CSV文件 里面标注了顾客们的地理位置 请问如何把这些地理位置(以点的形式)投影在地图上呢 (不同颜色代表不同商场的顾客)?
谢谢!!!!!
YU
您好!
我刚刚尝试了一下 做出了点
map=get_map(location=c(lon=-1.0000000,lat=47.000000),zoom=7,maptype=”roadmap”)
ggmap(map)
ggmap(map) + geom_point(aes(x=-0.76464,y=48.06789))
我大概猜测只需要把geom_point 里的 x值 和y值变成两个columns就可以标出所有的点?
请问有没有办法可以把这些点做成4个classes?每个classes的颜色不同?
谢谢!
HsuanU
謝謝你的整理!
幫助很大
于嫙
很實用,謝謝分享!
ethan
很棒!!佩服
visit here
Nice weblog right here! Also your site rather
a lot up very fast! What web host are you the
use of? Can I am getting your affiliate hyperlink in your
host? I want my website loaded up as fast as yours lol
Get More Info
each time i used to read smaller articles that also clear their motive, and that is also happening with this piece of writing which
I am reading now.