
使用 Markdown 語法
如果不喜歡 HTML 的一大堆標籤,reveal.js 也可以使用 Markdown 的語法來編寫簡報,首先加上 Markdown 的外掛:
dependencies: [ {
  src: 'plugin/markdown/marked.js',
  condition: function() {
    return !!document.querySelector( '[data-markdown]' );
  }
}, {
  src: 'plugin/markdown/markdown.js',
  condition: function() {
    return !!document.querySelector( '[data-markdown]' );
  }
} ]
接就可以使用 Markdown 的語法了:
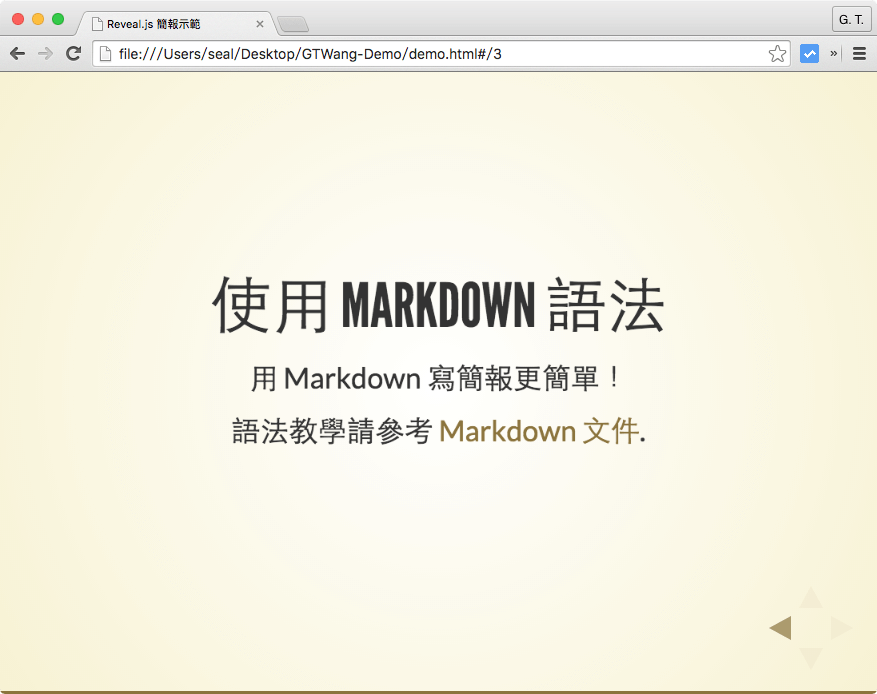
<section data-markdown>
  <script type="text/template">
    ## 使用 Markdown 語法

    用 Markdown 寫簡報更簡單!

    語法教學請參考 [Markdown 文件](http://markdown.tw/).
  </script>
</section>
這樣寫起簡報來會更簡潔,製作出來的簡報畫面一樣很漂亮:
分段顯示
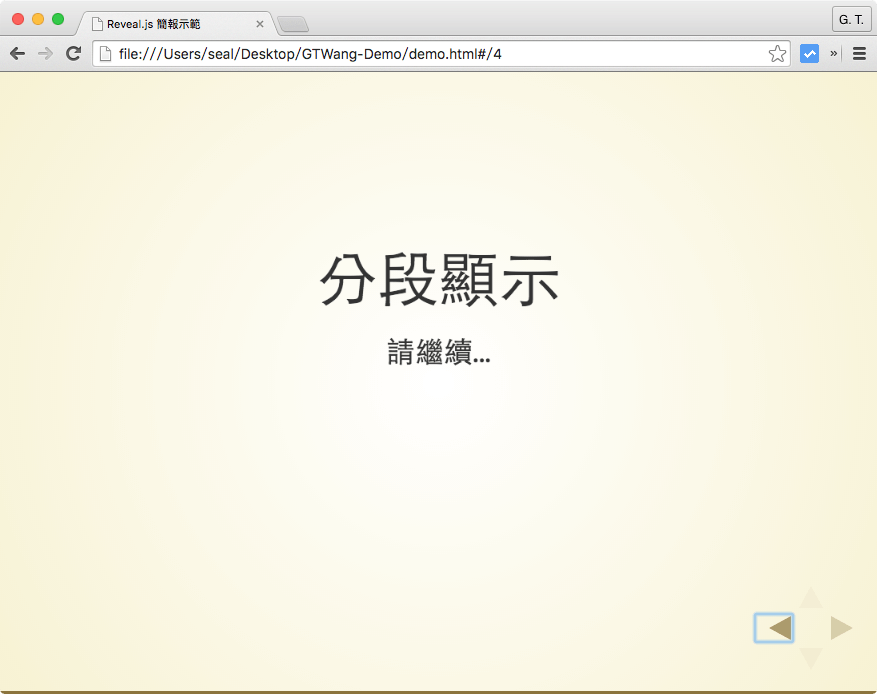
分段顯示是簡報上常用的呈現方式,讓簡報一開始不要顯示全部的內容,讓內容隨著講者的陳述依序顯示出來,以下是一個範例。
<section>
  <h2>分段顯示</h2>
  <p>請繼續...</p>
  <p class="fragment">... 顯示 ...</p>
  <p>
    <span class="fragment">下一個 ...</span>
    <span class="fragment">項目</span>
  </p>
</section>
這樣簡報的內容就可以隨的講者的控制依序出現:
圖形與表格
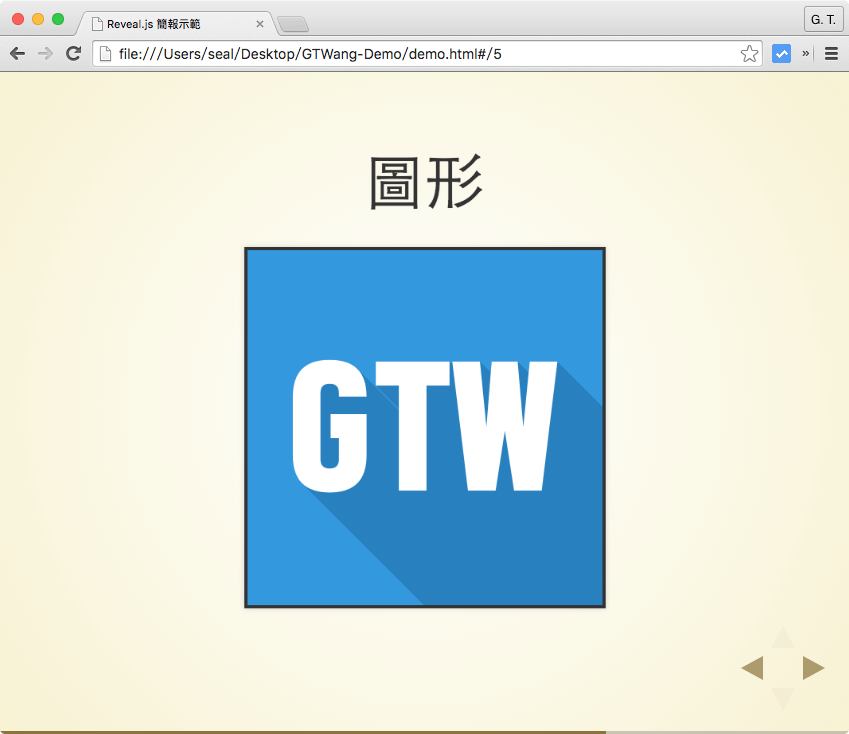
圖形與表格的加入就跟一般的網頁一樣,只要使用普通的 HTML 語法即可。這是加入圖形的範例:
<section>
  <h2>圖形</h2>
  <img data-src="gtwang-logo.png" />
</section>
加入圖形的簡報畫面:
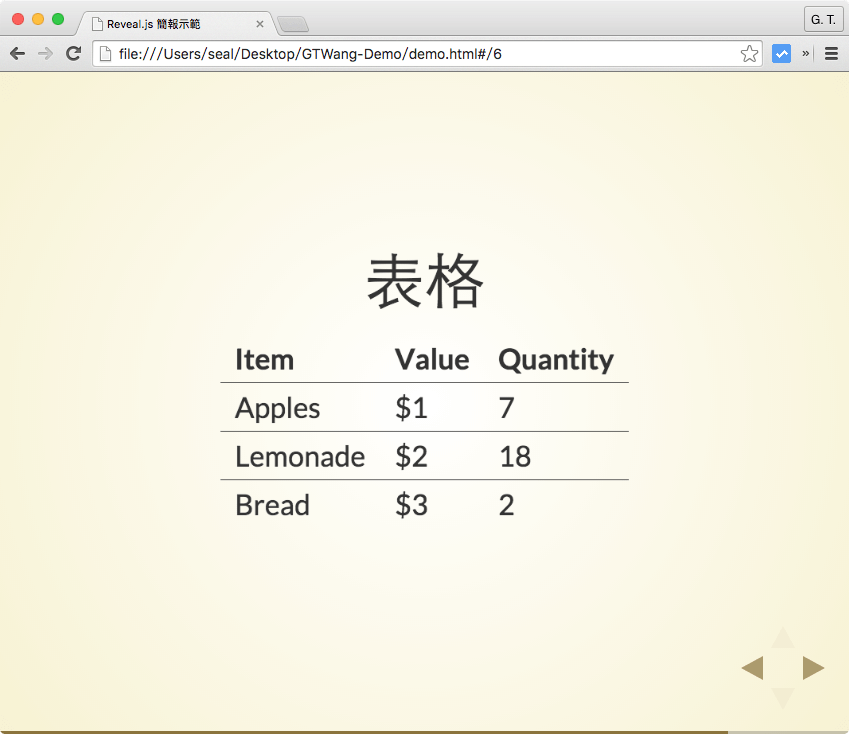
這是加入表格的範例:
<section>
  <h2>表格</h2>
  <table>
    <thead>
      <tr>
        <th>Item</th>
        <th>Value</th>
        <th>Quantity</th>
      </tr>
    </thead>
    <tbody>
      <tr>
        <td>Apples</td>
        <td>$1</td>
        <td>7</td>
      </tr>
      <tr>
        <td>Lemonade</td>
        <td>$2</td>
        <td>18</td>
      </tr>
      <tr>
        <td>Bread</td>
        <td>$3</td>
        <td>2</td>
      </tr>
    </tbody>
  </table>
</section>
加入表格的簡報畫面:
以上是 reveal.js 基本的介紹,其實它的功能還不只如此,詳細的說明可以參考 reveal.js 的 GitHub 網頁。
參考資料:HTML Cheats、Devs Trend
繼續閱讀: 12