這裡介紹如何在使用 R 畫圖時,自行指定中文字型,讓圖形更美觀,同時亦可解決亂碼問題。
在使用 R 繪圖時,若需要在圖形中加入中文字,若字型沒有設定好,中文字就很容易出問題。
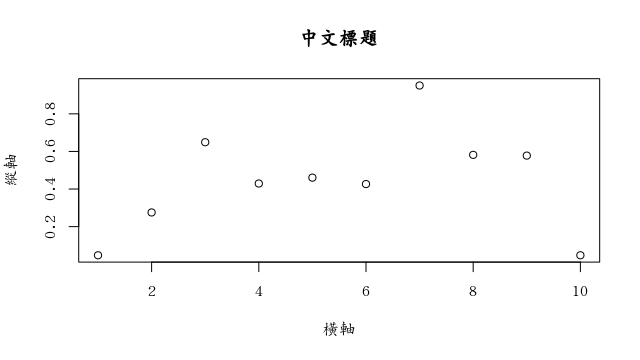
這是一個很簡單的繪圖範例,我們在座標軸的名稱與圖形標題中加入中文字:
plot(runif(10), xlab = "橫軸", ylab = "縱軸", main = "中文標題")
以我的測試結果而言,在 Windows 與 Linux 中可以正常顯示,但在 Mac OS X 中就會變成這樣:
使用 family 指定字型
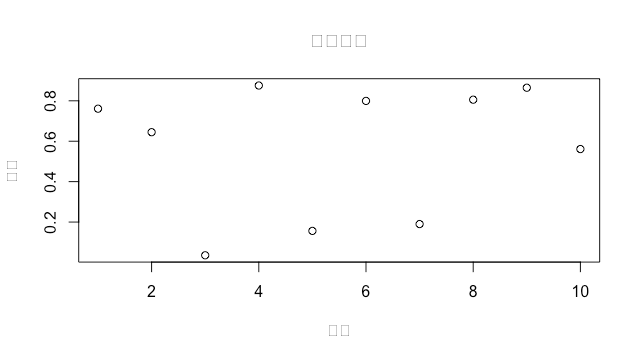
如果出現這種中文無法顯示的問題,可以用 family 參數指定字型:
plot(runif(10), xlab = "橫軸", ylab = "縱軸", main = "中文標題",
  family = "AR PL UKai TW")
family 可以指定為任何系統上的字型,在 Linux 中若要查詢可用的字型,可以使用 fc-list:
fc-list
/usr/share/fonts/truetype/lato/Lato-Medium.ttf: Lato,Lato Medium:style=Medium,Regular
/usr/share/fonts/truetype/tlwg/TlwgTypo-Bold.ttf: Tlwg Typo:style=Bold
/usr/share/fonts/truetype/adf/AccanthisADFStd-Regular.otf: Accanthis ADF Std:style=Regular
/usr/share/fonts/truetype/lato/Lato-SemiboldItalic.ttf: Lato,Lato Semibold:style=Semibold Italic,Italic
/usr/share/texmf/fonts/opentype/public/lm/lmmonolt10-oblique.otf: Latin Modern Mono Light,LM Mono Light 10:style=10 Oblique,Italic
[略]
使用 showtext 讀取字型檔
若想要直接使用字型檔並且將圖形輸出至各種圖檔,可以使用 showtext 這個套件:
install.packages("showtext")
library(showtext)
透過 showtext 套件,我們就可以直接從字型檔讀取字型,並在繪圖時使用:
showtext.auto(enable = TRUE)
font.add("康熙字典體", "康熙字典體.otf")
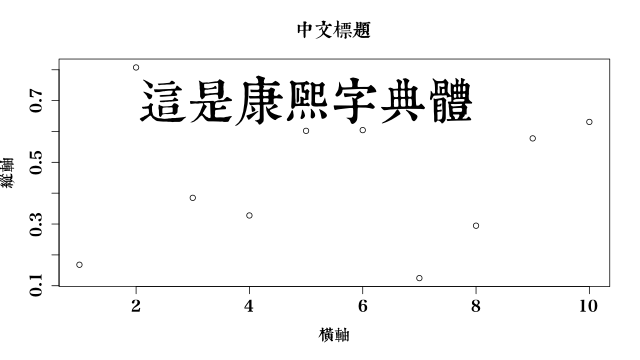
這裡我們從 康熙字典體.otf 這個 Open Type 字型檔中讀取字型,建立一個 康熙字典體 字型,接著就可以在一般的繪圖函數中透過 family 參數來使用這個字體。
png("output.png", width = 640, height = 360)
plot(runif(10), xlab = "橫軸", ylab = "縱軸", main = "中文標題",
  family = "康熙字典體")
text(5, 0.7, "這是康熙字典體", cex = 3, family = "康熙字典體")
dev.off()
這是輸出至 png 圖檔的結果:
showtext 支援的字型檔案格式有很多種,包含 True Type、Open Type、Type 1 以及各種網頁字型,而在輸出圖檔格式上則有支援 png、pdf 與 svg。
ggplot2 繪圖系統也可以使用 showtext 更改字型:
library(ggplot2)
png("output2.png", width = 640, height = 360)
ggplot(data.frame(x = rnorm(100))) +
  geom_histogram(aes(x)) + labs(x = '數值', y = '數量') +
  theme(text = element_text(family = '康熙字典體')) +
  annotate("text", x = 0, y = 7, label = "這是康熙字典體",
    family = '康熙字典體', size = 16)
dev.off()
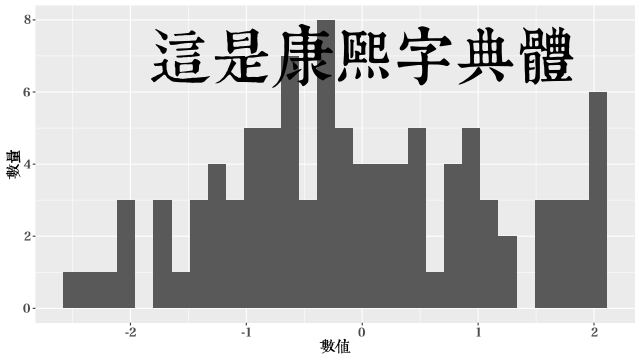
這是以 ggplot2 配合 showtext 畫出來的圖形:
使用 macOS 內建字型
macOS 的使用者可以直接從字體簿中查詢可用的系統字型。
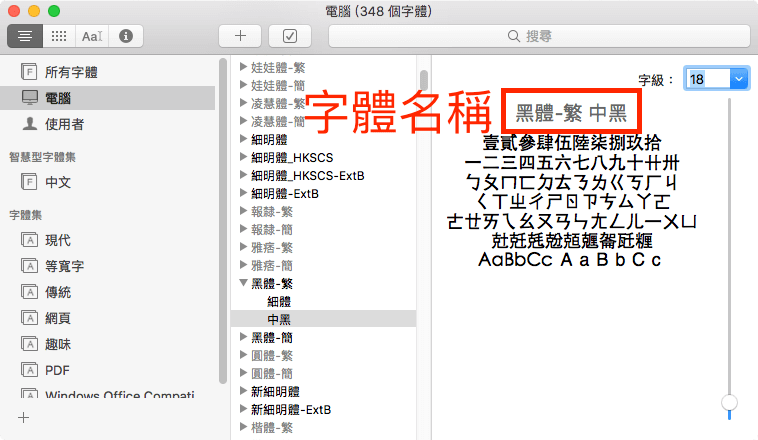
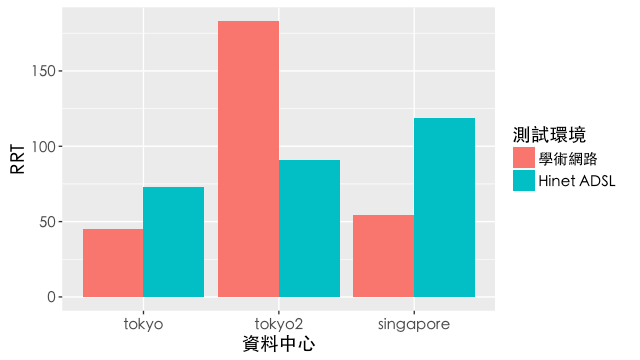
接著再將查到的字體名稱套用至 family 中即可。以下是一個在 ggplot2 中指定中文字體的範例:
library(ggplot2)
df <- data.frame(
  RRT = c(72.724, 90.582, 118.956, 45.090, 183.071, 54.094),
  資料中心 = factor(rep(c("tokyo", "tokyo2", "singapore"), 2),
    levels = c("tokyo", "tokyo2", "singapore")),
  測試環境 = factor(c(rep("Hinet ADSL", 3), rep("學術網路", 3))))
ggplot(df, aes(x = 資料中心, y = RRT, fill = 測試環境)) +
  geom_bar(position = position_dodge(), stat = "identity") +
  theme(text=element_text(family="黑體-繁 中黑", size=14))
這是畫出來的圖形,這樣 ggplot 圖形的中文就可以正常顯示: