這裡介紹如何使用 cProfile 測量 Python 程式效能、找出效能瓶頸,並以 gprof2dot 產生視覺化分析圖表。
較為大型的計算程式在開發完成後,通常都會接續著進行程式的執行效能測量與分析(profiling),找出程式的瓶頸所在,針對少數關鍵的程式碼進一步做最佳化,改善整體程式的執行速度。
在 Python 中若要進行程式效能分析,有好幾種方式可以使用(請參考 Python 官方手冊),而對於一般的使用者而言,最適合的方式就是使用 cProfile 模組,以下是使用方式與實際範例。
Python 範例程式
以下是一個簡單的 Python 程式 pi.py,此程式的目的是以蒙地卡羅方法計算 Pi 的近似值:
from __future__ import division
import random

# 模擬次數
NB_POINTS = 10**7

# 判斷點是否落於單位圓內
def in_circle(x, y):
  return x**2 + y**2 < 1

# 計算 Pi 近似值
def compute_pi(nb_it):
  inside_count = sum(1 for _ in range(nb_it) if in_circle(random.random(),random.random()))
  return (inside_count / nb_it) * 4

if __name__ == "__main__":
  print(compute_pi(NB_POINTS))
接下來我們將示範如何以 cProfile 來測量這個程式的執行狀況。
cProfile 分析程式執行狀況
若要測量一個獨立的程式,最直接又簡單的方式就是在執行時引入 cProfile 模組:
python3 -m cProfile -s cumtime pi.py
在使用 -m 引入 cProfile 模組之後,再加上 -s 參數指定排序欄位,這裡我們以累計執行時間來排序(cumtime),執行後就會輸出類似這樣的量測報表:
37857794 function calls (37857773 primitive calls) in 12.203 seconds

   Ordered by: cumulative time

   ncalls  tottime  percall  cumtime  percall filename:lineno(function)
      4/1    0.000    0.000   12.203   12.203 {built-in method exec}
        1    0.000    0.000   12.203   12.203 pi.py:1(<module>)
        1    0.000    0.000   12.193   12.193 pi.py:12(compute_pi)
        1    0.873    0.873   12.193   12.193 {built-in method sum}
  7855933    6.159    0.000   11.320    0.000 pi.py:13(<genexpr>)
 10000000    3.942    0.000    3.942    0.000 pi.py:8(in_circle)
 20000000    1.219    0.000    1.219    0.000 {method 'random' of '_random.Random' objects}
      6/2    0.000    0.000    0.010    0.005 <frozen importlib._bootstrap>:2234(_find_and_load)
[略]
這個報表的欄位意義如下:
| 欄位 | 意義 |
|---|---|
ncalls | 呼叫次數(number of calls)。 |
tottime | 總執行時間(total time),不含子函數的執行時間。 |
percall | tottime 除以 ncalls。 |
cumtime | 累計執行時間(cumulative time),包含子函數的執行時間。 |
percall | cumtime 除以 ncalls。 |
filename:lineno(function) | 函數名稱。 |
測試程式碼片段
如果只是要在 Python 程式中測試幾行程式的執行效能,可以使用 cProfile.run 執行要測量的程式碼:
from __future__ import division
import random

# 引入 cProfile 模組
import cProfile

NB_POINTS = 10**7

def in_circle(x, y):
  return x**2 + y**2 < 1

def compute_pi(nb_it):
  inside_count = sum(1 for _ in range(nb_it) if in_circle(random.random(),random.random()))
  return (inside_count / nb_it) * 4

if __name__ == "__main__":
  # 測試程式碼片段
  cProfile.run('compute_pi(NB_POINTS)')
這樣就會輸出程式碼片段的測量結果:
37853493 function calls in 12.514 seconds

   Ordered by: standard name

   ncalls  tottime  percall  cumtime  percall filename:lineno(function)
        1    0.000    0.000   12.514   12.514 <string>:1(<module>)
        1    0.000    0.000   12.514   12.514 pi.py:12(compute_pi)
  7853488    6.341    0.000   11.590    0.000 pi.py:13(<genexpr>)
 10000000    3.983    0.000    3.983    0.000 pi.py:9(in_circle)
        1    0.000    0.000   12.514   12.514 {built-in method exec}
        1    0.924    0.924   12.514   12.514 {built-in method sum}
        1    0.000    0.000    0.000    0.000 {method 'disable' of '_lsprof.Profiler' objects}
 20000000    1.265    0.000    1.265    0.000 {method 'random' of '_random.Random' objects}
cProfile 結果輸出至檔案
由於 cProfile 的報表非常長,若是較為複雜的程式,我們會把這些資料以輸出至檔案:
python3 -m cProfile -o pi.pstats pi.py
-o 參數可以指定輸出的檔案名稱,其輸出的檔案格式是二進位檔,若要觀看這個檔案,可以使用 Python 的 pstats 模組:
python3 -m pstats pi.pstats
進入 pstats 模組的互動式環境後,可用各種指令來整理與查看報表,鍵入問號 ? 可以看到可用的指令。最常用的指令就使用 sort 設定排序欄位:
sort cumtime
接著再用 stats 輸出報表:
stats
其輸出的報表就跟上面的類似。
Fri Dec 15 14:00:51 2017    pi.pstats

         37858722 function calls (37858701 primitive calls) in 12.282 seconds

   Ordered by: cumulative time

   ncalls  tottime  percall  cumtime  percall filename:lineno(function)
      4/1    0.000    0.000   12.282   12.282 {built-in method exec}
        1    0.000    0.000   12.282   12.282 pi.py:1(<module>)
        1    0.000    0.000   12.272   12.272 pi.py:12(compute_pi)
        1    0.886    0.886   12.272   12.272 {built-in method sum}
  7856861    6.190    0.000   11.386    0.000 pi.py:13(<genexpr>)
 10000000    3.967    0.000    3.967    0.000 pi.py:8(in_circle)
 20000000    1.229    0.000    1.229    0.000 {method 'random' of '_random.Random' objects}
 [略]
以 gprof2dot 產生視覺化圖形
若程式架構很複雜,光看簡單的文字報表可能會很難分析,這時候我們可以使用 gprof2dot 這個小工具,把 pstats 的資料轉為 dot 的格式,再將 dot 資料畫成圖形,以視覺化的方式呈現程式中各個函數之間的執行關係。
首先安裝 gprof2dot 這個 Python 模組:
sudo pip3 install gprof2dot
若要畫圖的話,也要安裝 graphviz:
# Ubuntu Linux
sudo apt-get install graphviz

# CentOS Linux
sudo yum install graphviz
安裝好必要的工具之後,就可以將剛剛產生的 pi.pstats 轉為 dot 資料,直接畫出圖形來:
python3 -m gprof2dot -f pstats pi.pstats | dot -T png -o pi_profile.png
畫出來的圖會像這樣:
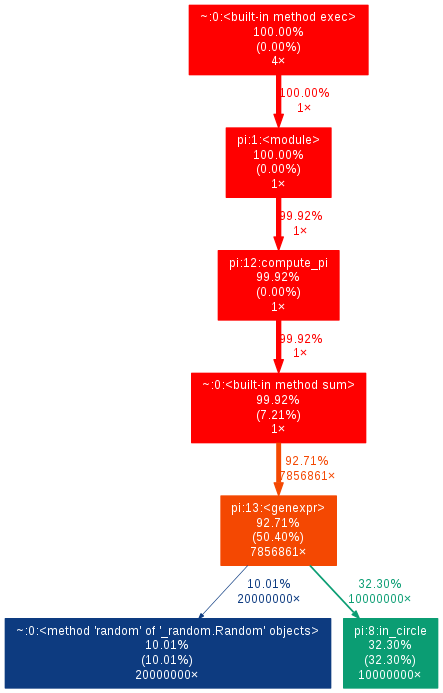
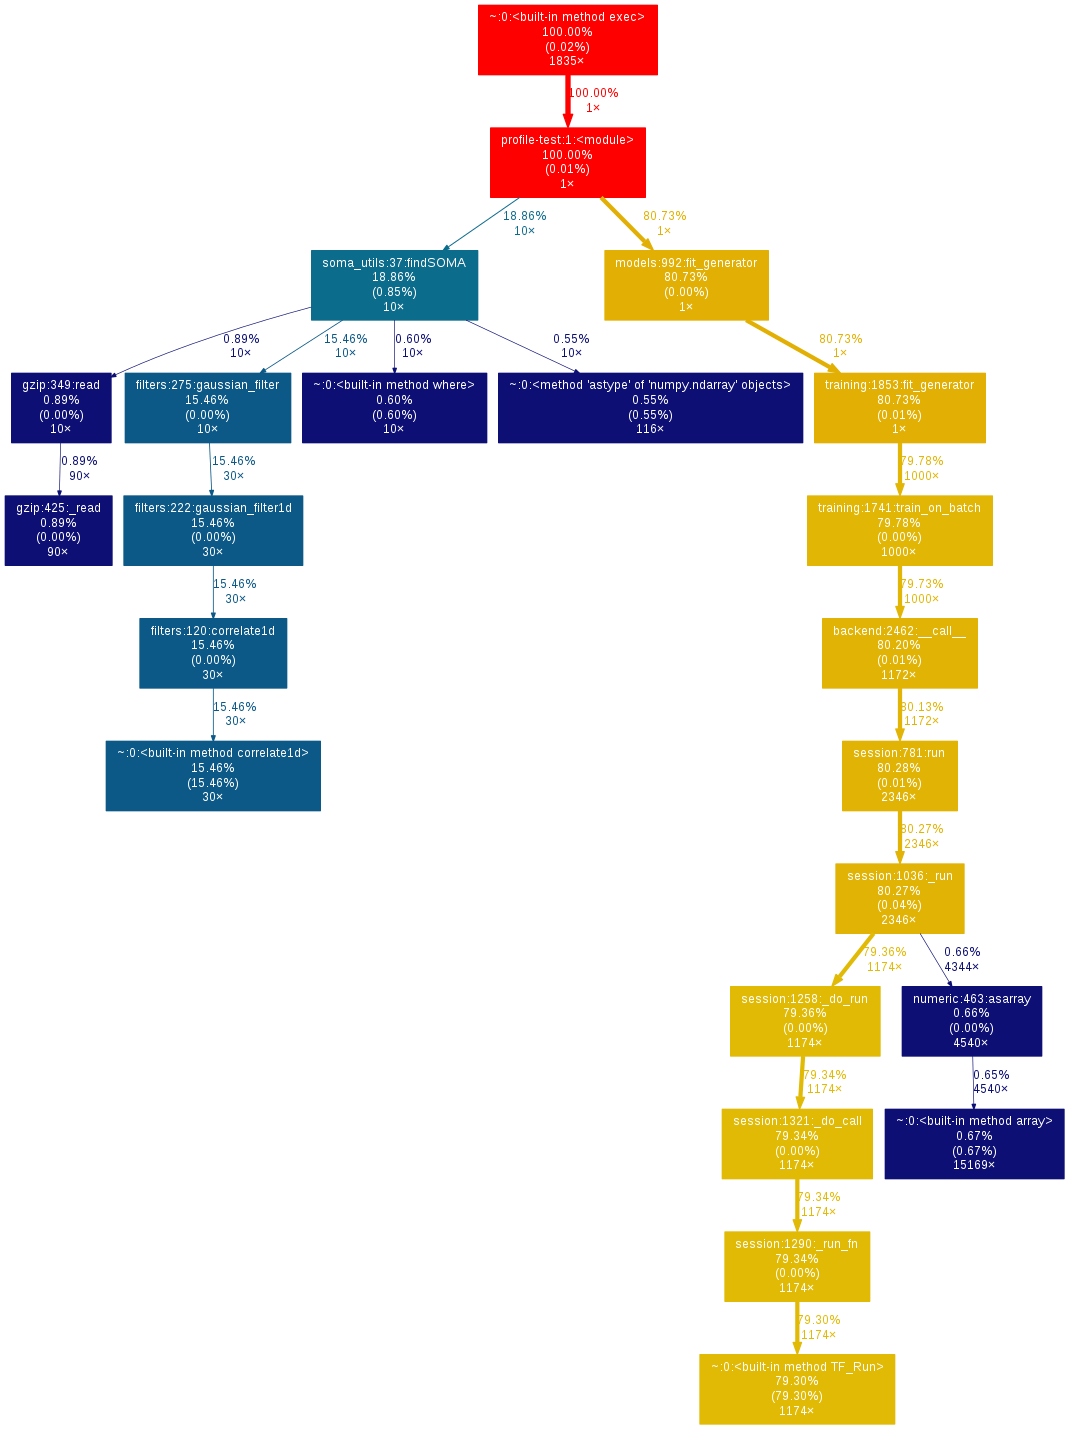
上面這個計算 Pi 的範例因為比較單純,所以程式的流程圖畫出來比較陽春,感覺不出他有多好用,但若是換成實際的範例就會差很多。
下面這張圖是我實際正在處理的 AI 分析程式,中間牽涉到影像的處理、還有使用到 Keras 以 GPU 來計算,靠這種圖來抓出程式的瓶頸會比文字報表方便很多。