幾何圖形(Geom)
幾何圖形是一個圖形中最主要的繪圖部分,它可以控制圖形的類型,例如 point 可以產生散佈圖、line 可以產生折線圖,下表是各種在 ggplot 系統中可用的幾何圖形。
| 幾何圖形 | 說明 |
|---|---|
abline |
以斜率與截距來指定的直線。 |
bar |
長條圖。 |
bin2d |
heatmap。 |
blank |
空圖層。 |
boxplot |
箱形圖。 |
contour |
等高線圖。 |
count |
計算每個位置的數目。 |
crossbar |
lines, crossbars and errorbars。 |
density |
密度函數圖。 |
density_2d |
二維密度函數圖。。 |
dotplot |
dot plot。 |
errorbarh |
Horizontal error bars。 |
freqpoly |
直方圖。 |
hex |
Hexagon binning。 |
jitter |
jitter 資料點。 |
label |
文字標示。 |
map |
地圖。 |
path |
路徑。 |
point |
資料點。 |
polygon |
多邊形。 |
quantile |
Add quantile lines from a quantile regression。 |
raster |
方形區域。 |
ribbon |
區間。 |
rug |
rug plot。 |
segment |
線段與曲線。 |
smooth |
平滑曲線。 |
violin |
小提琴圖。 |
最新的幾何圖形列表請參考 ggplot 的官方網站。
不同的幾何圖形可接受的美學對應參數都不同,而每一種幾何圖形都有預設的統計轉換,這些詳細的參數說明可以參考 ggplot 的官方網站。
統計轉換(Stat)
統計轉換是指將原始的資料經過某些計算,轉換為比較精簡、容易呈現的資料,例如平滑曲線就是一種很有用的統計轉換,它可以依據資料的分佈算出一條平滑曲線,呈現資料大致上的走向,最新的各種統計轉換可以從 ggplot 的官方網站查詢。
統計轉換會使用資料來源的 data frame 作為輸入,而計算完之後會輸出新的 data frame,所以我們甚至可以在美學對應上使用統計轉換中所產生的變數。例如 stat_bin 這個用於建立直方圖的統計轉換就會產生以下幾個變數:
count:每個 bin 的資料點數。density:每個 bin 的資料點數比例。ncount:將count標準化,最大值為1。ndensity:將density標準化,最大值為1。
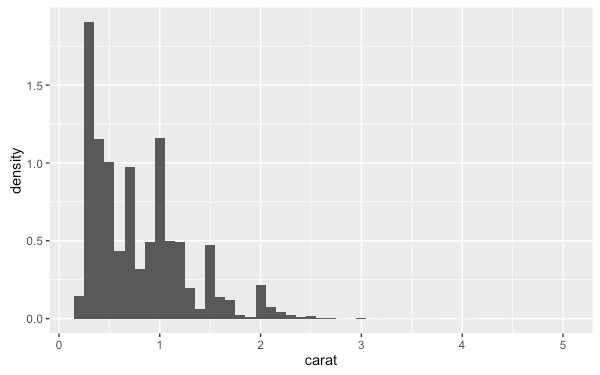
這些由統計轉換所產生的變數,在某些圖形上可以用來替代原始的資料,例如直方圖預設會以資料的數量作為高度,如果想要改以密度為單位,就可以使用 density 這個變數:
ggplot(diamonds, aes(carat)) +
  geom_histogram(aes(y = ..density..), binwidth = 0.1)
要取用統計轉換所產生的變數時,必須前後加上 ..(例如 ..density..),這是為了與原始資料的變數有所區隔,也可以讓程式碼在閱讀上更清晰。在 qplot 函數中也可以使用這樣的方式取用統計轉換所產生的變數:
qplot(carat, ..density.., data = diamonds,
  geom="histogram", binwidth = 0.1)
位置調整(Position)
位置調整的功能主要是用於調整圖層中幾何圖形的比較細微的位置選項,處理繪圖時資料重疊的問題,通常用於類別型的資料。下表是 ggplot 系統中可用的位置調整選項。
| 位置調整選項 | 說明 |
|---|---|
dodge |
並列顯示。 |
fill |
標準化堆疊顯示。 |
identity |
不調整位置。 |
jitter |
使用 jitter 方式避免資料點重疊。 |
stack |
堆疊顯示。 |
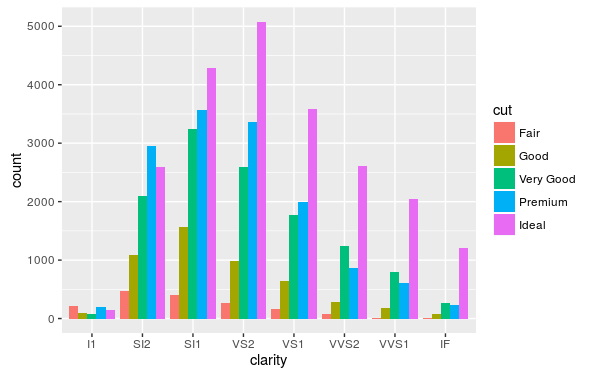
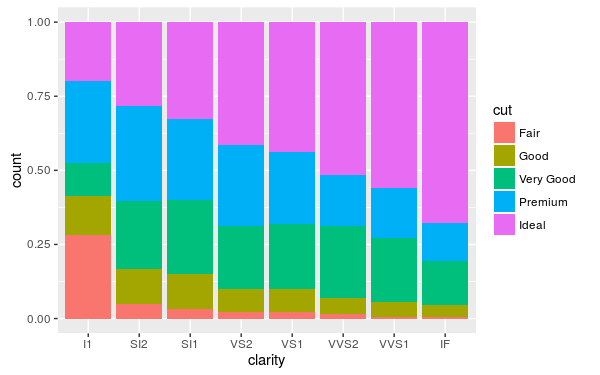
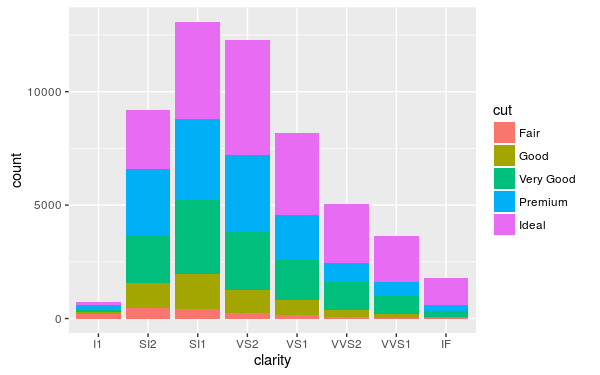
要理解這些選項的差異,從直方圖上來看會比較明顯。
ggplot(diamonds, aes(clarity, fill=cut)) + geom_bar(position="dodge")
ggplot(diamonds, aes(clarity, fill=cut)) + geom_bar(position="fill")
ggplot(diamonds, aes(clarity, fill=cut)) + geom_bar(position="stack")
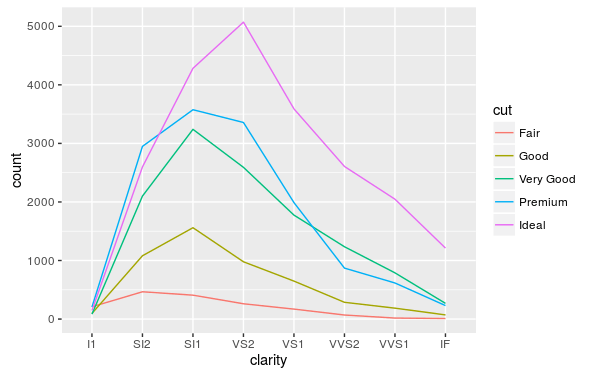
identity 適合用在一般的折線圖:
ggplot(diamonds, aes(clarity, group = cut)) +
  geom_line(aes(color = cut), position="identity", stat = "count")
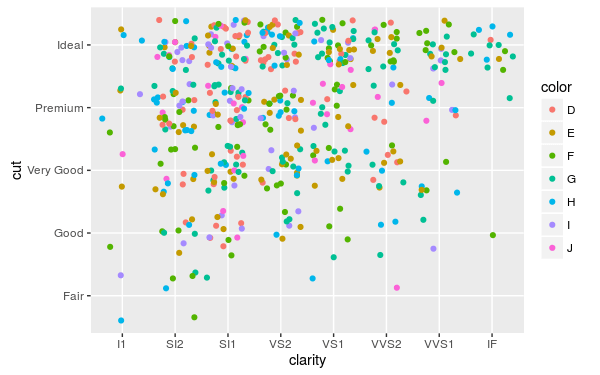
jitter 通常適用於以資料點繪製類別型資料的情況:
set.seed(5)
diamonds.subset <- diamonds[sample(nrow(diamonds), 500), ]
ggplot(diamonds.subset, aes(clarity, cut)) +
  geom_point(aes(color = color), position="jitter")


