InfluxDB 是一個專門適用於時間序列用的資料庫,這裡介紹如何在 Ubuntu Linux 中安裝並使用它。
InfluxDB 是一個開放原始碼、分散式的時間序列資料庫,適合用來儲存大量連續行的觀測資料,例如系統的 CPU 與記憶體使用狀態監測,或是一些感測器(sensors)的連續監測資料。
以下是在 Ubuntu Linux 中安裝 InfluxDB 資料庫的步驟,並且示範簡單的使用方式。
Step 1
依照作業系統選擇適當的安裝方式:
64 位元的 Ubuntu Linux:
wget http://s3.amazonaws.com/influxdb/influxdb_latest_amd64.deb
sudo dpkg -i influxdb_latest_amd64.deb
32 位元的 Ubuntu Linux:
wget http://s3.amazonaws.com/influxdb/influxdb_latest_i386.deb
sudo dpkg -i influxdb_latest_i386.deb
Step 2
啟動 InfluxDB 系統服務:
sudo service influxdb start
Step 3
開啟瀏覽器,輸入伺服器的位址並加上 8083 這個連接埠,
http://IP-ADDRESS:8083/
如果您是在本機安裝 InfluxDB,則直接輸入
http://localhost:8083/
Step 4
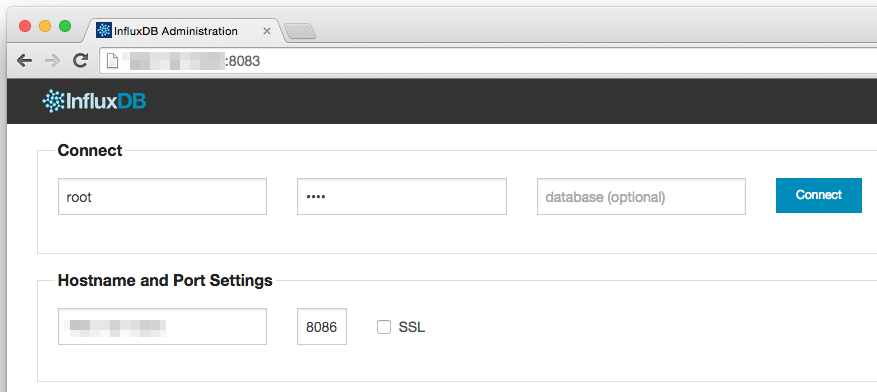
開啟之後應該會看到 InfluxDB 的登入畫面,預設的管理者帳號是 root,而密碼也是 root,預設的連接埠為 8086。
Step 5
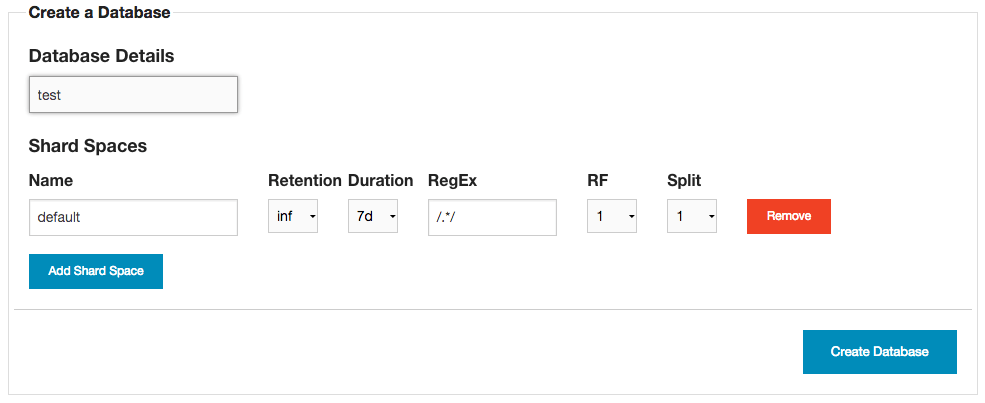
連上資料庫之後,就可以開始使用了。由於一開始整個資料庫是空的,使用前要建立一個新的資料庫(Create a Database)。
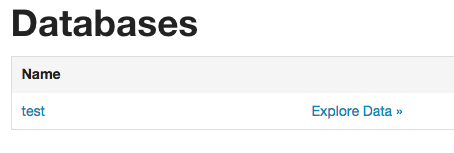
這裡我建立一個 test 資料庫。
Step 6
另外也順便建立一個 test 資料庫專用的帳號,這裡因為是示範教學,我將帳號與密碼都設定為 test。
Step 7
接著我們先用 JavaScript 測試輸入資料,開啟瀏覽器的 console,執行以下這個 JavaScript:
// start time of 24 hours ago
var backMilliseconds = 86000 * 1000;
var startTime = new Date() - backMilliseconds;
var timeInterval = 60 * 1000;
var eventTypes = ["click", "view", "post", "comment"];

var cpuSeries = {
  name:    "cpu_idle",
  columns: ["time", "value", "hostName"],
  points:  []
};

var eventSeries = {
  name:    "customer_events",
  columns: ["time", "customerId", "type"],
  points:  []
};

for (i = 0; i < backMilliseconds; i += timeInterval) {
  // generate fake cpu idle host values
  var hostName = "server" + Math.floor(Math.random() * 100);
  var value = Math.random() * 100;
  var pointValues = [startTime + i, value, hostName];
  cpuSeries.points.push(pointValues);

  // generate some fake customer events
  for (j = 0; j < Math.random() * 10; j += 1) {
    var customerId = Math.floor(Math.random() * 1000);
    var eventTypeIndex = Math.floor(Math.random() * 1000 % 4);
    var eventValues = [startTime + i, customerId, eventTypes[eventTypeIndex]];
    eventSeries.points.push(eventValues);
  }
}

influxdb.writeSeries([cpuSeries, eventSeries]);
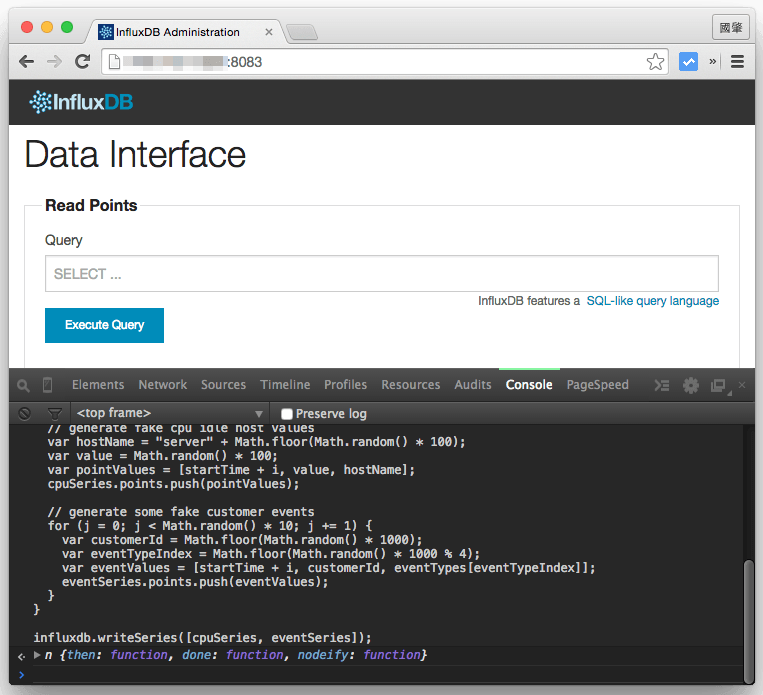
這段 JavaScript 會將一些測試的資料輸入資料庫。這裡要注意一點,因為這段 JavaScript 會用到 InfluxDB 的函式庫,所以要在 InfluxDB 管理介面的網頁中打開 console 才能正常執行,就像這樣:
Step 8
輸入測試資料之後,再查詢一下:
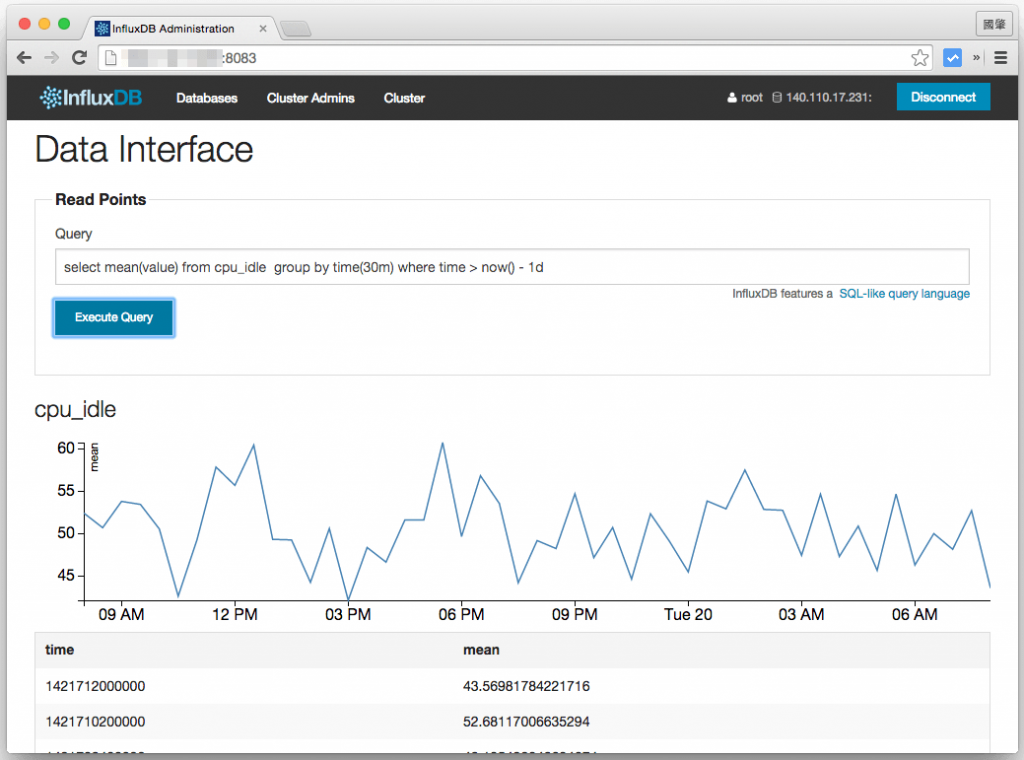
select mean(value) from cpu_idle group by time(30m) where time > now() - 1d
這個查詢會顯示近一天之內,每 30 分鐘的 cpu_idle 平均值,查詢的結果會包含時間序列的圖形與原始資料:
只查詢 server1 的 cpu_idle 資料:
select mean(value) from cpu_idle group by time(30m) where time > now() - 1d and hostName = 'server1'
查詢近一小時內的資料筆數:
select count(value) from cpu_idle where time > now() - 1h
查詢近一天之內,customer_events 每十分鐘的資料筆數:
select count(customerId) from customer_events where time > now() - 1d group by time(10m)
查詢近一小時內 customer_events 中不重複的 customerId:
select distinct(customerId) as customerId from customer_events where time > now() - 1h


