地圖資料來源
Leaflet 使用圖磚(map tiles)的方式繪製基本地圖,目前網路上的各種地圖服務大部分也都是使用這種方式。
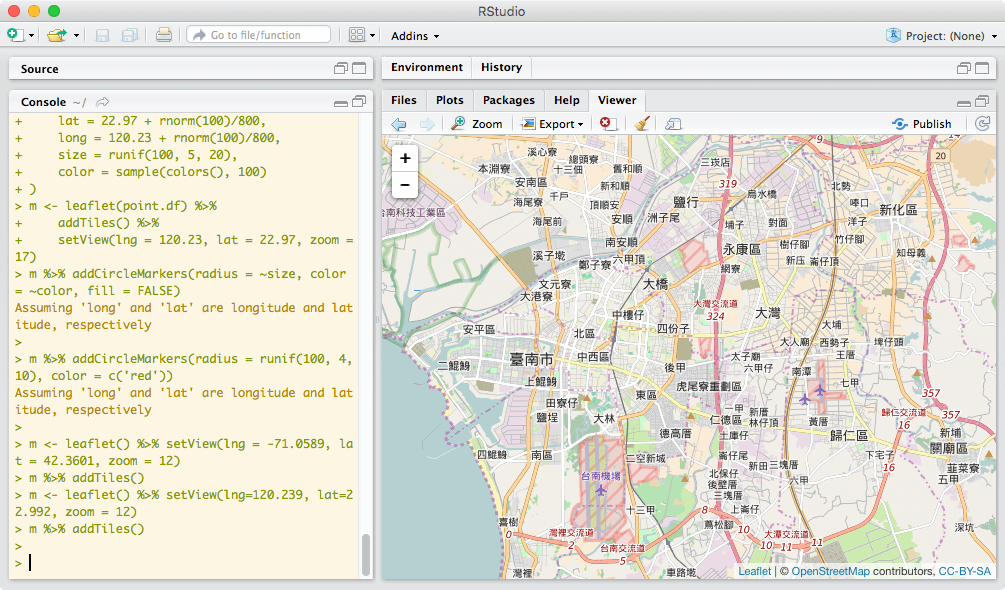
要在 leaflet 地圖物件上加上基本的地圖,可以使用 addTiles:
m <- leaflet() %>% setView(lng=120.239, lat=22.992, zoom = 12)
m %>% addTiles()
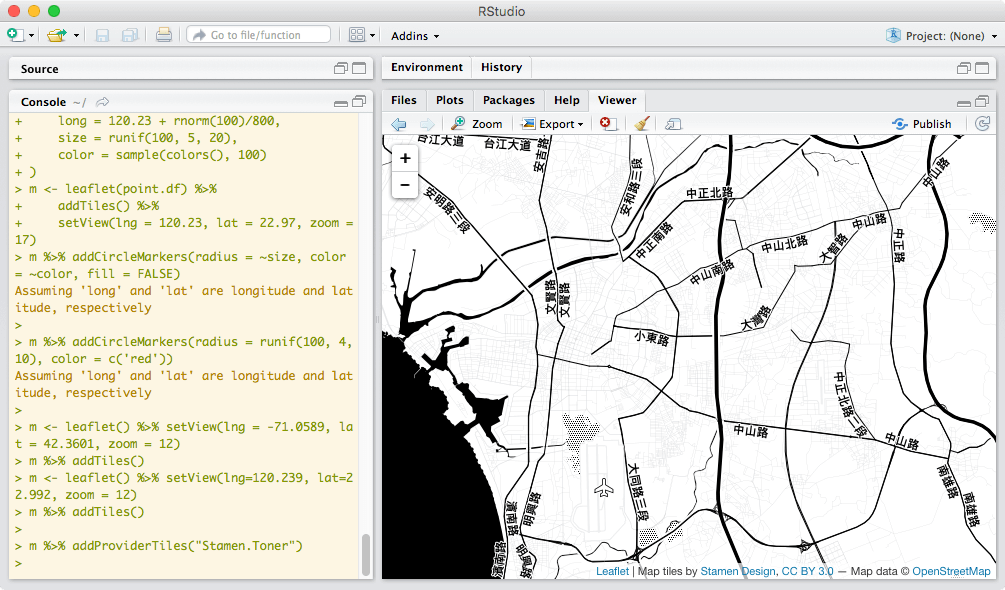
Leaflet 預設會使用 OpenStreetMap 的地圖資料,除此之外也可以使用 addProviderTiles 指定不同的地圖資料來源:
m %>% addProviderTiles("Stamen.Toner")
addTiles 也可以允許使用者自定地圖資料來源的網址樣板。
WMS 圖磚
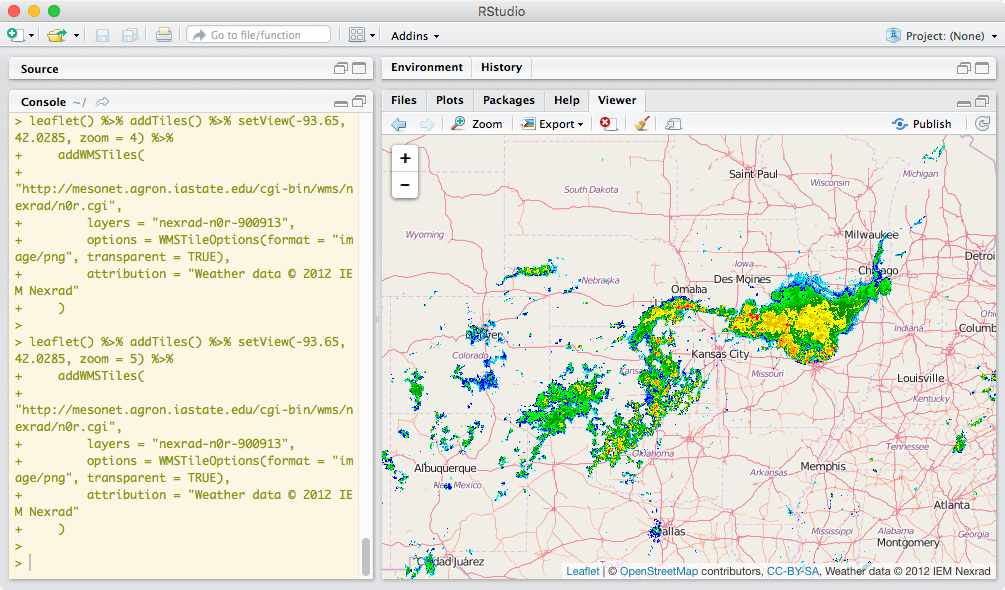
addWMSTiles 函數可以在地圖上加入 WMS(Web Map Service)圖磚,下面這個是顯示雷達回波圖的例子(資料來源為 Iowa Environmental Mesonet):
leaflet() %>% addTiles() %>% setView(-93.65, 42.0285, zoom = 5) %>%
  addWMSTiles(
    "http://mesonet.agron.iastate.edu/cgi-bin/wms/nexrad/n0r.cgi",
    layers = "nexrad-n0r-900913",
    options = WMSTileOptions(format = "image/png", transparent = TRUE),
    attribution = "Weather data © 2012 IEM Nexrad"
  )
多個地圖資料來源
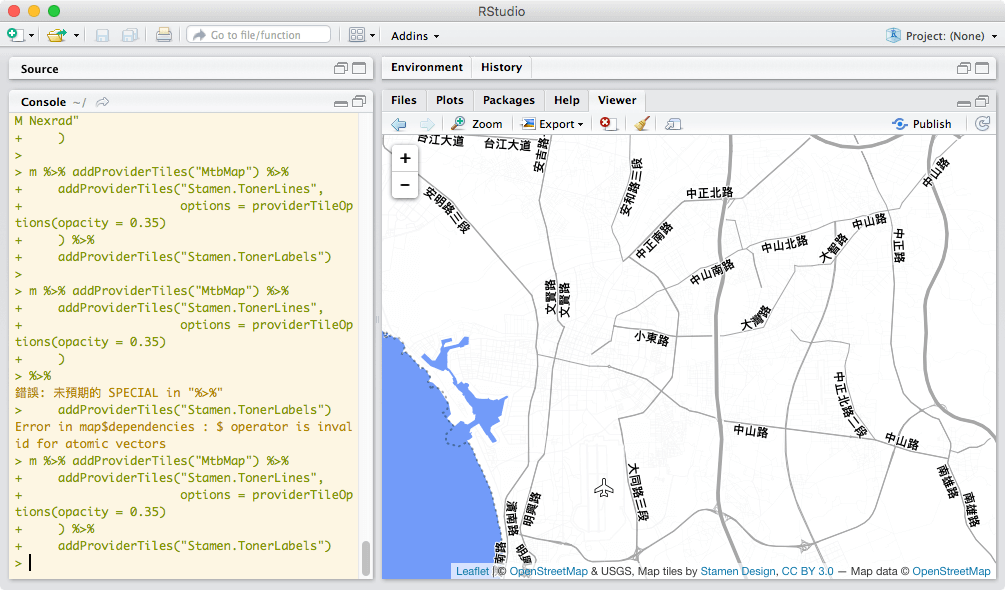
Leaflet 允許在一個地圖上同時加入多個地圖資料來源,通常可以利用透明度的設定,套疊多種地圖:
m %>% addProviderTiles("MtbMap") %>%
  addProviderTiles("Stamen.TonerLines",
    options = providerTileOptions(opacity = 0.35)
  ) %>%
  addProviderTiles("Stamen.TonerLabels")
地圖標示
地圖標示可以用來呈現地圖上的經緯度座標位置,我們可以使用 SpatialPoints、SpatialPointsDataFrame 的方式表示經緯度座標,或是直接使用兩個行(column)的矩陣來表示(第一行為經度,第二行為緯度)。另外也可以使用一般的 data frame 配合公式指定經緯度座標欄位,以下是一些使用範例。
圖示標示
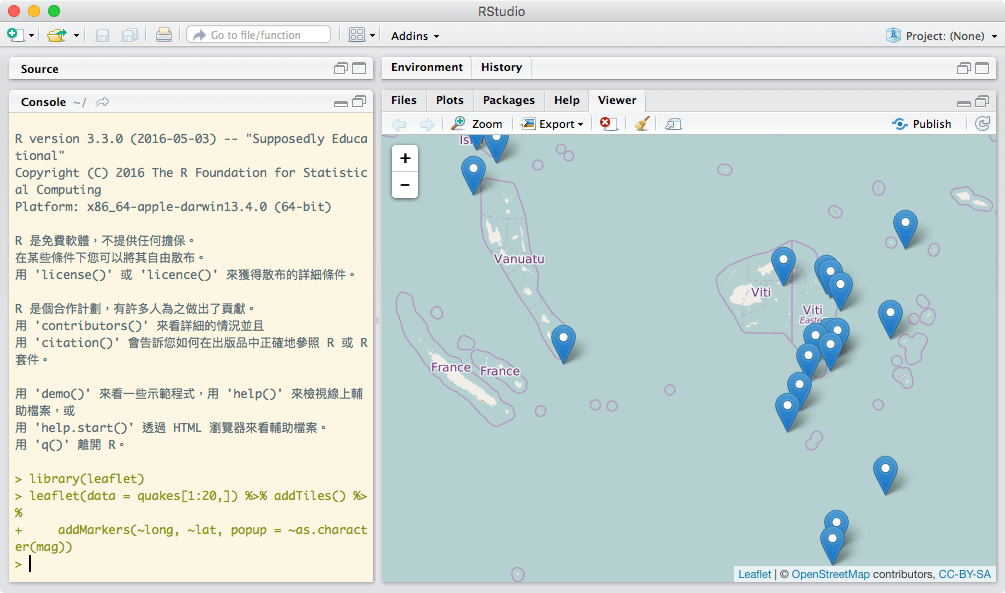
普通的圖示標示可以使用 addMarker 來加入,而其 popup 參數可以指定點擊標示時要出現訊息內容:
# 顯示 quakes 的前 20 筆資料
leaflet(data = quakes[1:20,]) %>% addTiles() %>%
  addMarkers(~long, ~lat, popup = ~as.character(mag))
自訂標示
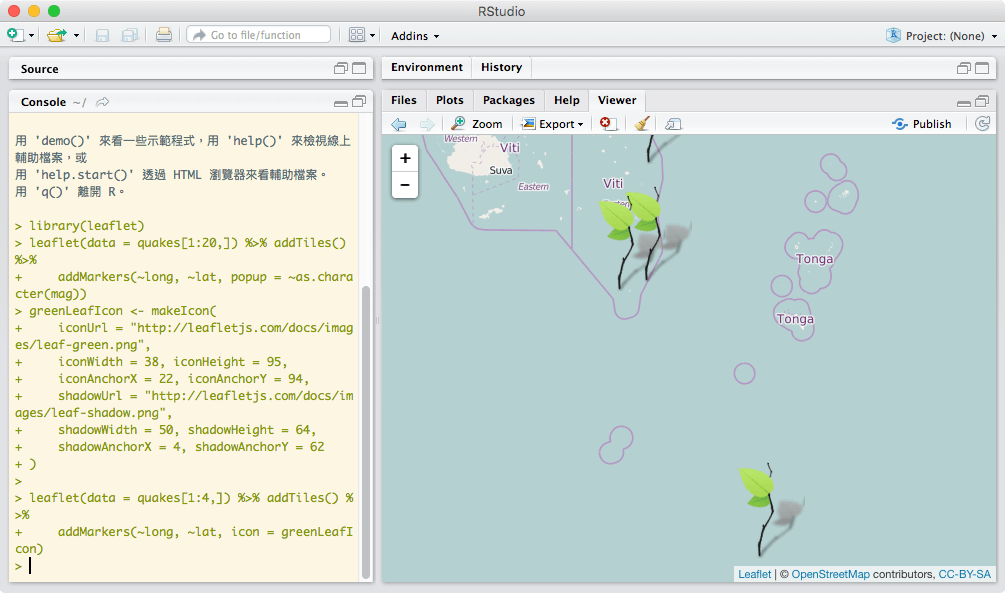
標示用的圖示也可以自行指定,例如利用 makeIcon 配合 URL 網址的方式指定圖檔:
greenLeafIcon <- makeIcon(
  iconUrl = "http://leafletjs.com/docs/images/leaf-green.png",
  iconWidth = 38, iconHeight = 95,
  iconAnchorX = 22, iconAnchorY = 94,
  shadowUrl = "http://leafletjs.com/docs/images/leaf-shadow.png",
  shadowWidth = 50, shadowHeight = 64,
  shadowAnchorX = 4, shadowAnchorY = 62
)

leaflet(data = quakes[1:4,]) %>% addTiles() %>%
  addMarkers(~long, ~lat, icon = greenLeafIcon)
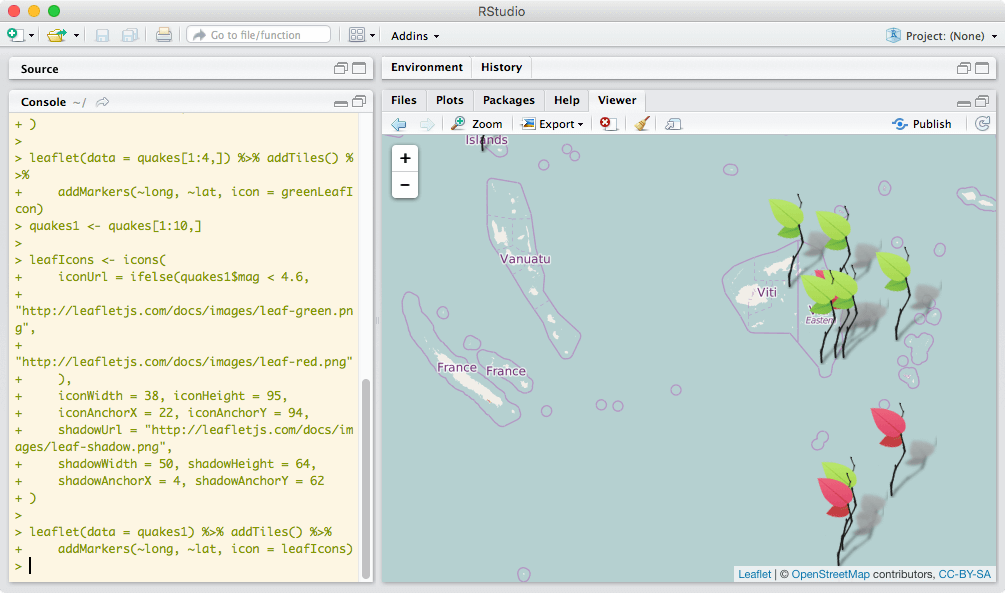
如果有多個同一系列的圖示,大小都相同,只是網址不同,則可以使用 icons 一次建立多個圖示:
quakes1 <- quakes[1:10,]

leafIcons <- icons(
  iconUrl = ifelse(quakes1$mag < 4.6,
    "http://leafletjs.com/docs/images/leaf-green.png",
    "http://leafletjs.com/docs/images/leaf-red.png"
  ),
  iconWidth = 38, iconHeight = 95,
  iconAnchorX = 22, iconAnchorY = 94,
  shadowUrl = "http://leafletjs.com/docs/images/leaf-shadow.png",
  shadowWidth = 50, shadowHeight = 64,
  shadowAnchorX = 4, shadowAnchorY = 62
)

leaflet(data = quakes1) %>% addTiles() %>%
  addMarkers(~long, ~lat, icon = leafIcons)
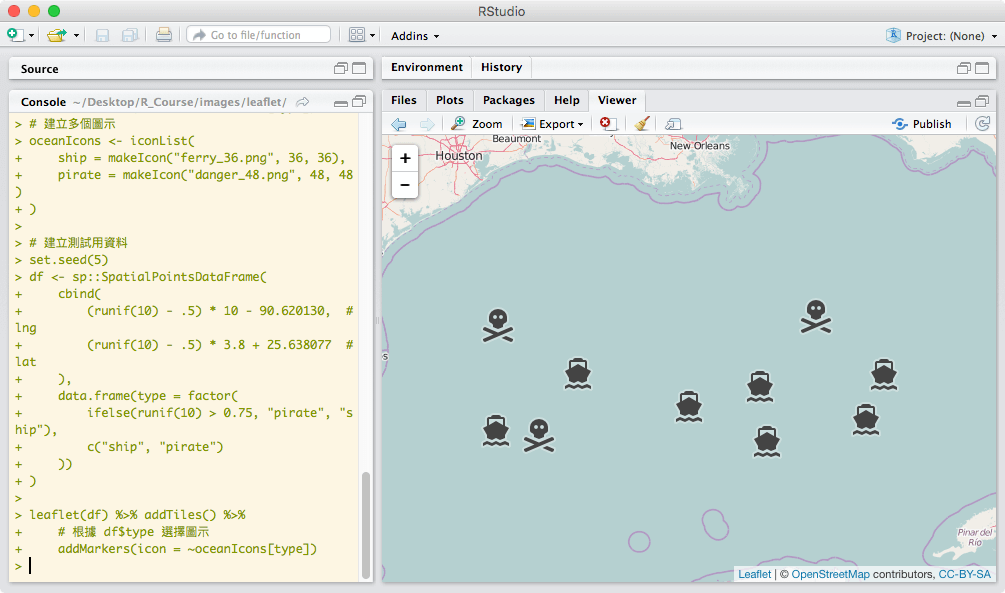
對於樣式大小都不同的多個圖示,則可使用 iconList 來處理:
# 建立多個圖示
oceanIcons <- iconList(
  ship = makeIcon("ferry_36.png", 36, 36),
  pirate = makeIcon("danger_48.png", 48, 48)
)

# 建立測試用資料
set.seed(5)
df <- sp::SpatialPointsDataFrame(
  cbind(
    (runif(10) - .5) * 10 - 90.620130,  # lng
    (runif(10) - .5) * 3.8 + 25.638077  # lat
  ),
  data.frame(type = factor(
    ifelse(runif(10) > 0.75, "pirate", "ship"),
    c("ship", "pirate")
  ))
)

leaflet(df) %>% addTiles() %>%
  # 根據 df$type 選擇圖示
  addMarkers(icon = ~oceanIcons[type])
如果想要自己畫出上面這個地圖,請先下載兩個圖示檔 ferry_36.png 與 danger_48.png。
叢集標示
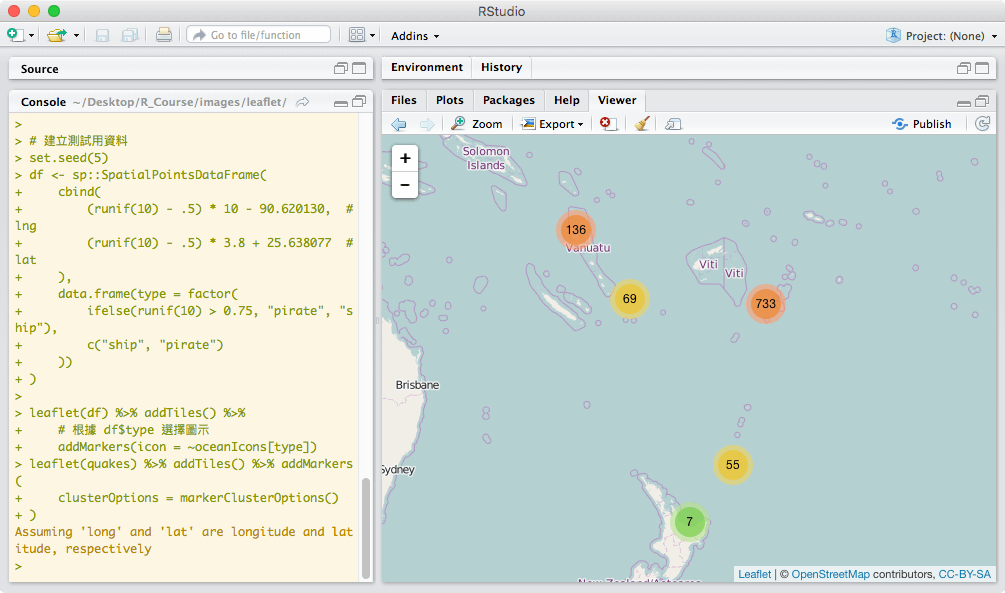
如果有大量的標示集中在同一個小區域,可以使用 Leaflet.markercluster 這個外掛工具,在 R 中可以使用 clusterOptions 參數來啟用這個外掛工具:
leaflet(quakes) %>% addTiles() %>% addMarkers(
  clusterOptions = markerClusterOptions()
)
圓圈標示
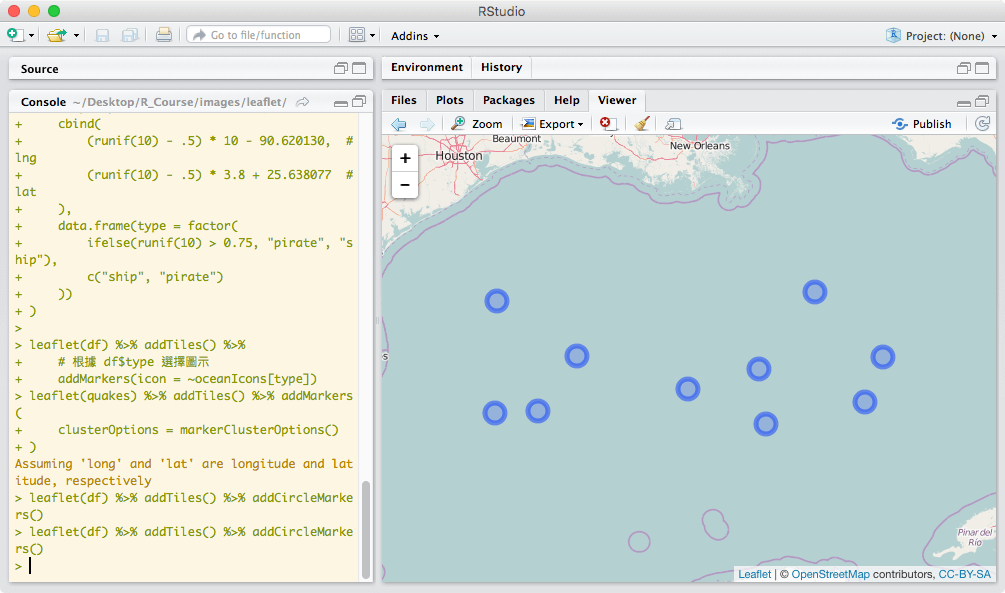
addCircleMarkers 可以在地圖上加上圓圈的標示,而這種圓圈的大小是固定的,不會因為縮放地圖而改變:
leaflet(df) %>% addTiles() %>% addCircleMarkers()
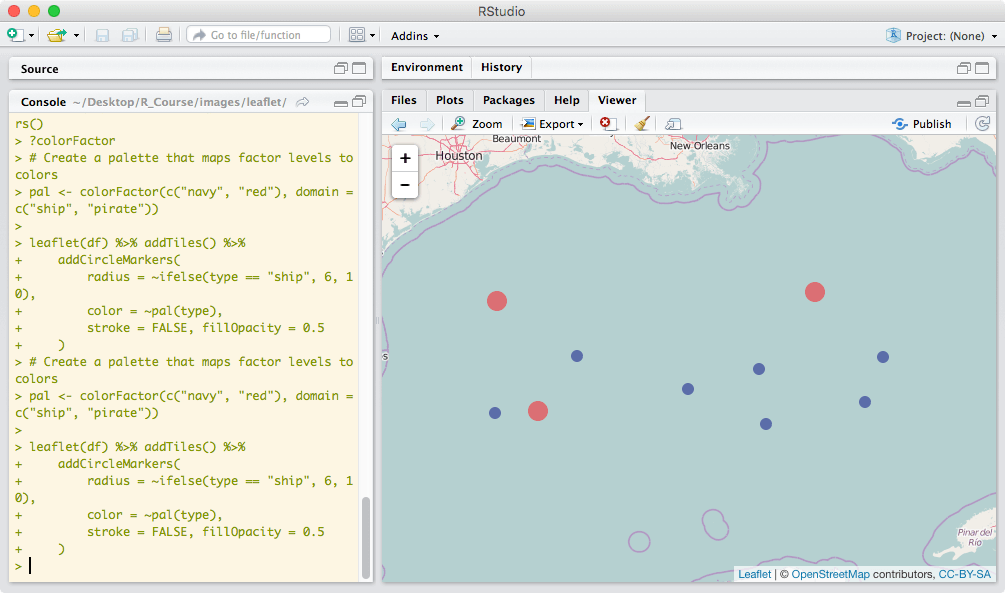
自訂圓圈的大小、顏色、樣式、透明度等屬性:
# 將因子對應至顏色
pal <- colorFactor(c("navy", "red"), domain = c("ship", "pirate"))

leaflet(df) %>% addTiles() %>%
  addCircleMarkers(
    radius = ~ifelse(type == "ship", 6, 10),
    color = ~pal(type),
    stroke = FALSE, fillOpacity = 0.5
  )


